Buy the Dip vs. Dollar Cost Averaging
Today, we will look at very fascinating data that compares a Dollar-Cost-Averaging Strategy to an All-Knowing Buy the Dip Strategy.
I’ve recently come across a statistic that I needed to share with you.
Quick Info: I got sick this week, so my next two Paid Sub Posts got a bit delayed. I’m currently writing a Streaming Sector Analysis and the Investment Thesis on two of my Portfolio Companies.
I hope I can finish them in the next few days. Sorry for that!
The statistic compared the Dollar-Cost-Averaging (DCA) strategy to Buying the Dip (BTD). The catch is that you’re all-knowing in the Buy the Dip strategy. So you always hit rock bottom with your buys.
The hypothesis is clear, right? An all-knowing BTD strategy has to be better than DCA.
Well, the results are pretty astounding. The statistic I’ve seen comes from Nick Maggiulli (@dollarsanddata), so shoutout to him.
He created the following scenario:
In the Dollar-Cost-Averaging Strategy, you invest $100 every month for 40 years.
In the Buy the Dip Strategy, you save those $100 every month until there is a dip. A dip is defined as a stock price below all-time highs.
So, as long as the market keeps rising, you save your $100. When there is a setback, you invest all those saved dollars. However, you’re all-knowing. So you don’t invest your money on the way down. You hit the exact bottom between two all-time highs.
What Strategy performs better?
Intuitively, one has to say BTD. Hitting rock bottom every time seems way too good.
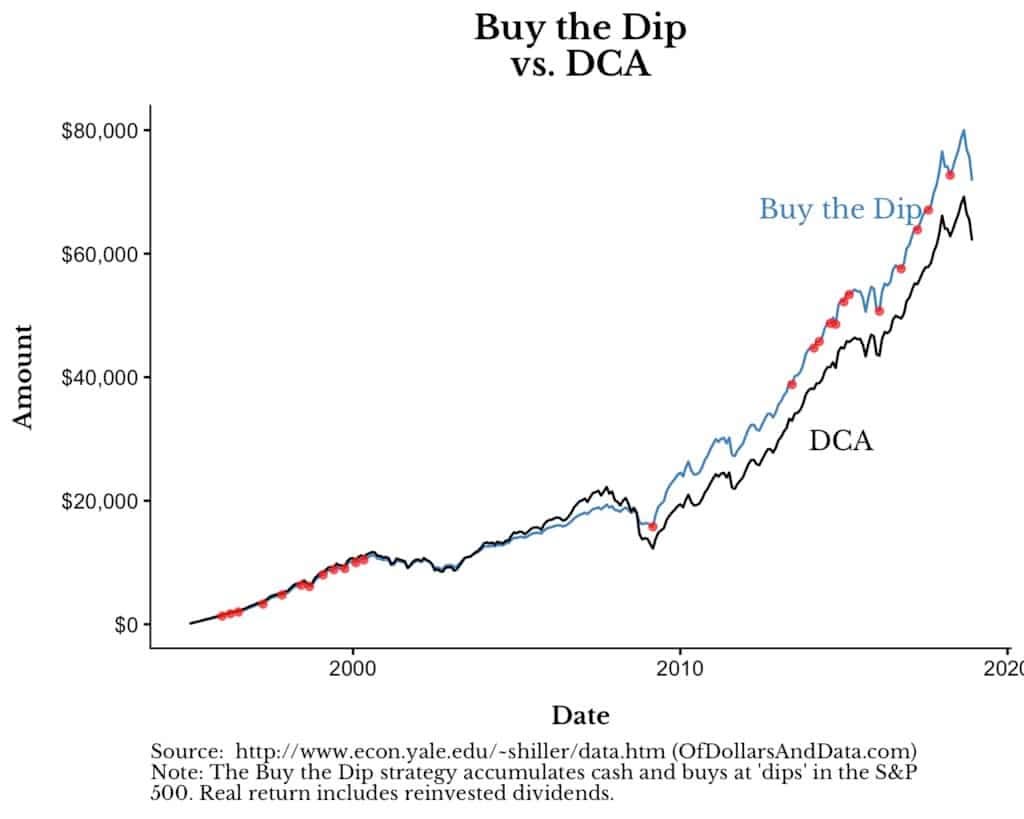
Interestingly, that’s not the case. And it’s not even close. The Buy the Dip strategy underperforms Dollar-Cost-Averaging over 70%(!) of the time.
Why is that?
The reason is due to two main principles of investing: Compounding and Time in the Market.
First of all, there are a lot more all-time highs than there are dips. Because of that, you stand on the sidelines for quite some time with the BTD strategy. And while you’re saving up your $100, the DCA strategy compounds the monthly invested dollars.
Secondly, most dips are not that severe. Even if you catch them at rock bottom, the downturn can’t make up for the time not invested. There are only a few dips as bad as the 2009 one.
Those dips make a huge difference. If we compare the performance of both strategies, you’ll see that the Buy the Dip strategy actually started outperforming after the 2009 dip.
In this chosen timeframe, the 2009 dip is also such an important driver of performance for the BTD strategy because it’s the first dip since the all-time high in 2000. Thus, A lot of dollars were saved and invested in that dip.
Conclusion
Compounding and Time in the Market are two incredibly powerful concepts. Buying the dip is often portrayed as the holy grail because it intuitively makes sense. But the data shows that this thesis is wrong.
And keep in mind we’ve assumed an all-knowing Buy the Dip Strategy. Since you and I are not all-knowing (sorry I drag you into this, maybe you are ;) ), we would do much(!) worse than this data suggests.
I initially saw this data only in a short post with pictures, but I found the original article now. If you want more details, check it out: https://ofdollarsanddata.com/even-god-couldnt-beat-dollar-cost-averaging/
If you enjoyed this post, I’d appreciate your support by liking it. If you have any questions or comments, let me know below!
Have a great Sunday, see you in a week.
Some of you earlier with my additional posts :)


